Google Ad Tech Remedies: A Marketer’s Measurement and Verification Checklist
.webp)
Google ad tech remedies are best treated as a set of operating rules that can change how auctions and access work over time, rather than an immediate structural reset. For marketers, the practical risk is measurement comparability: the same KPI labels can start reflecting different underlying auction mechanics. The most useful action is to baseline core auction and delivery metrics now so later performance shifts can be attributed correctly. Then run a recurring verification routine that reconciles partner reporting, tracks discrepancies, and re-tests learnings as auction dynamics evolve.
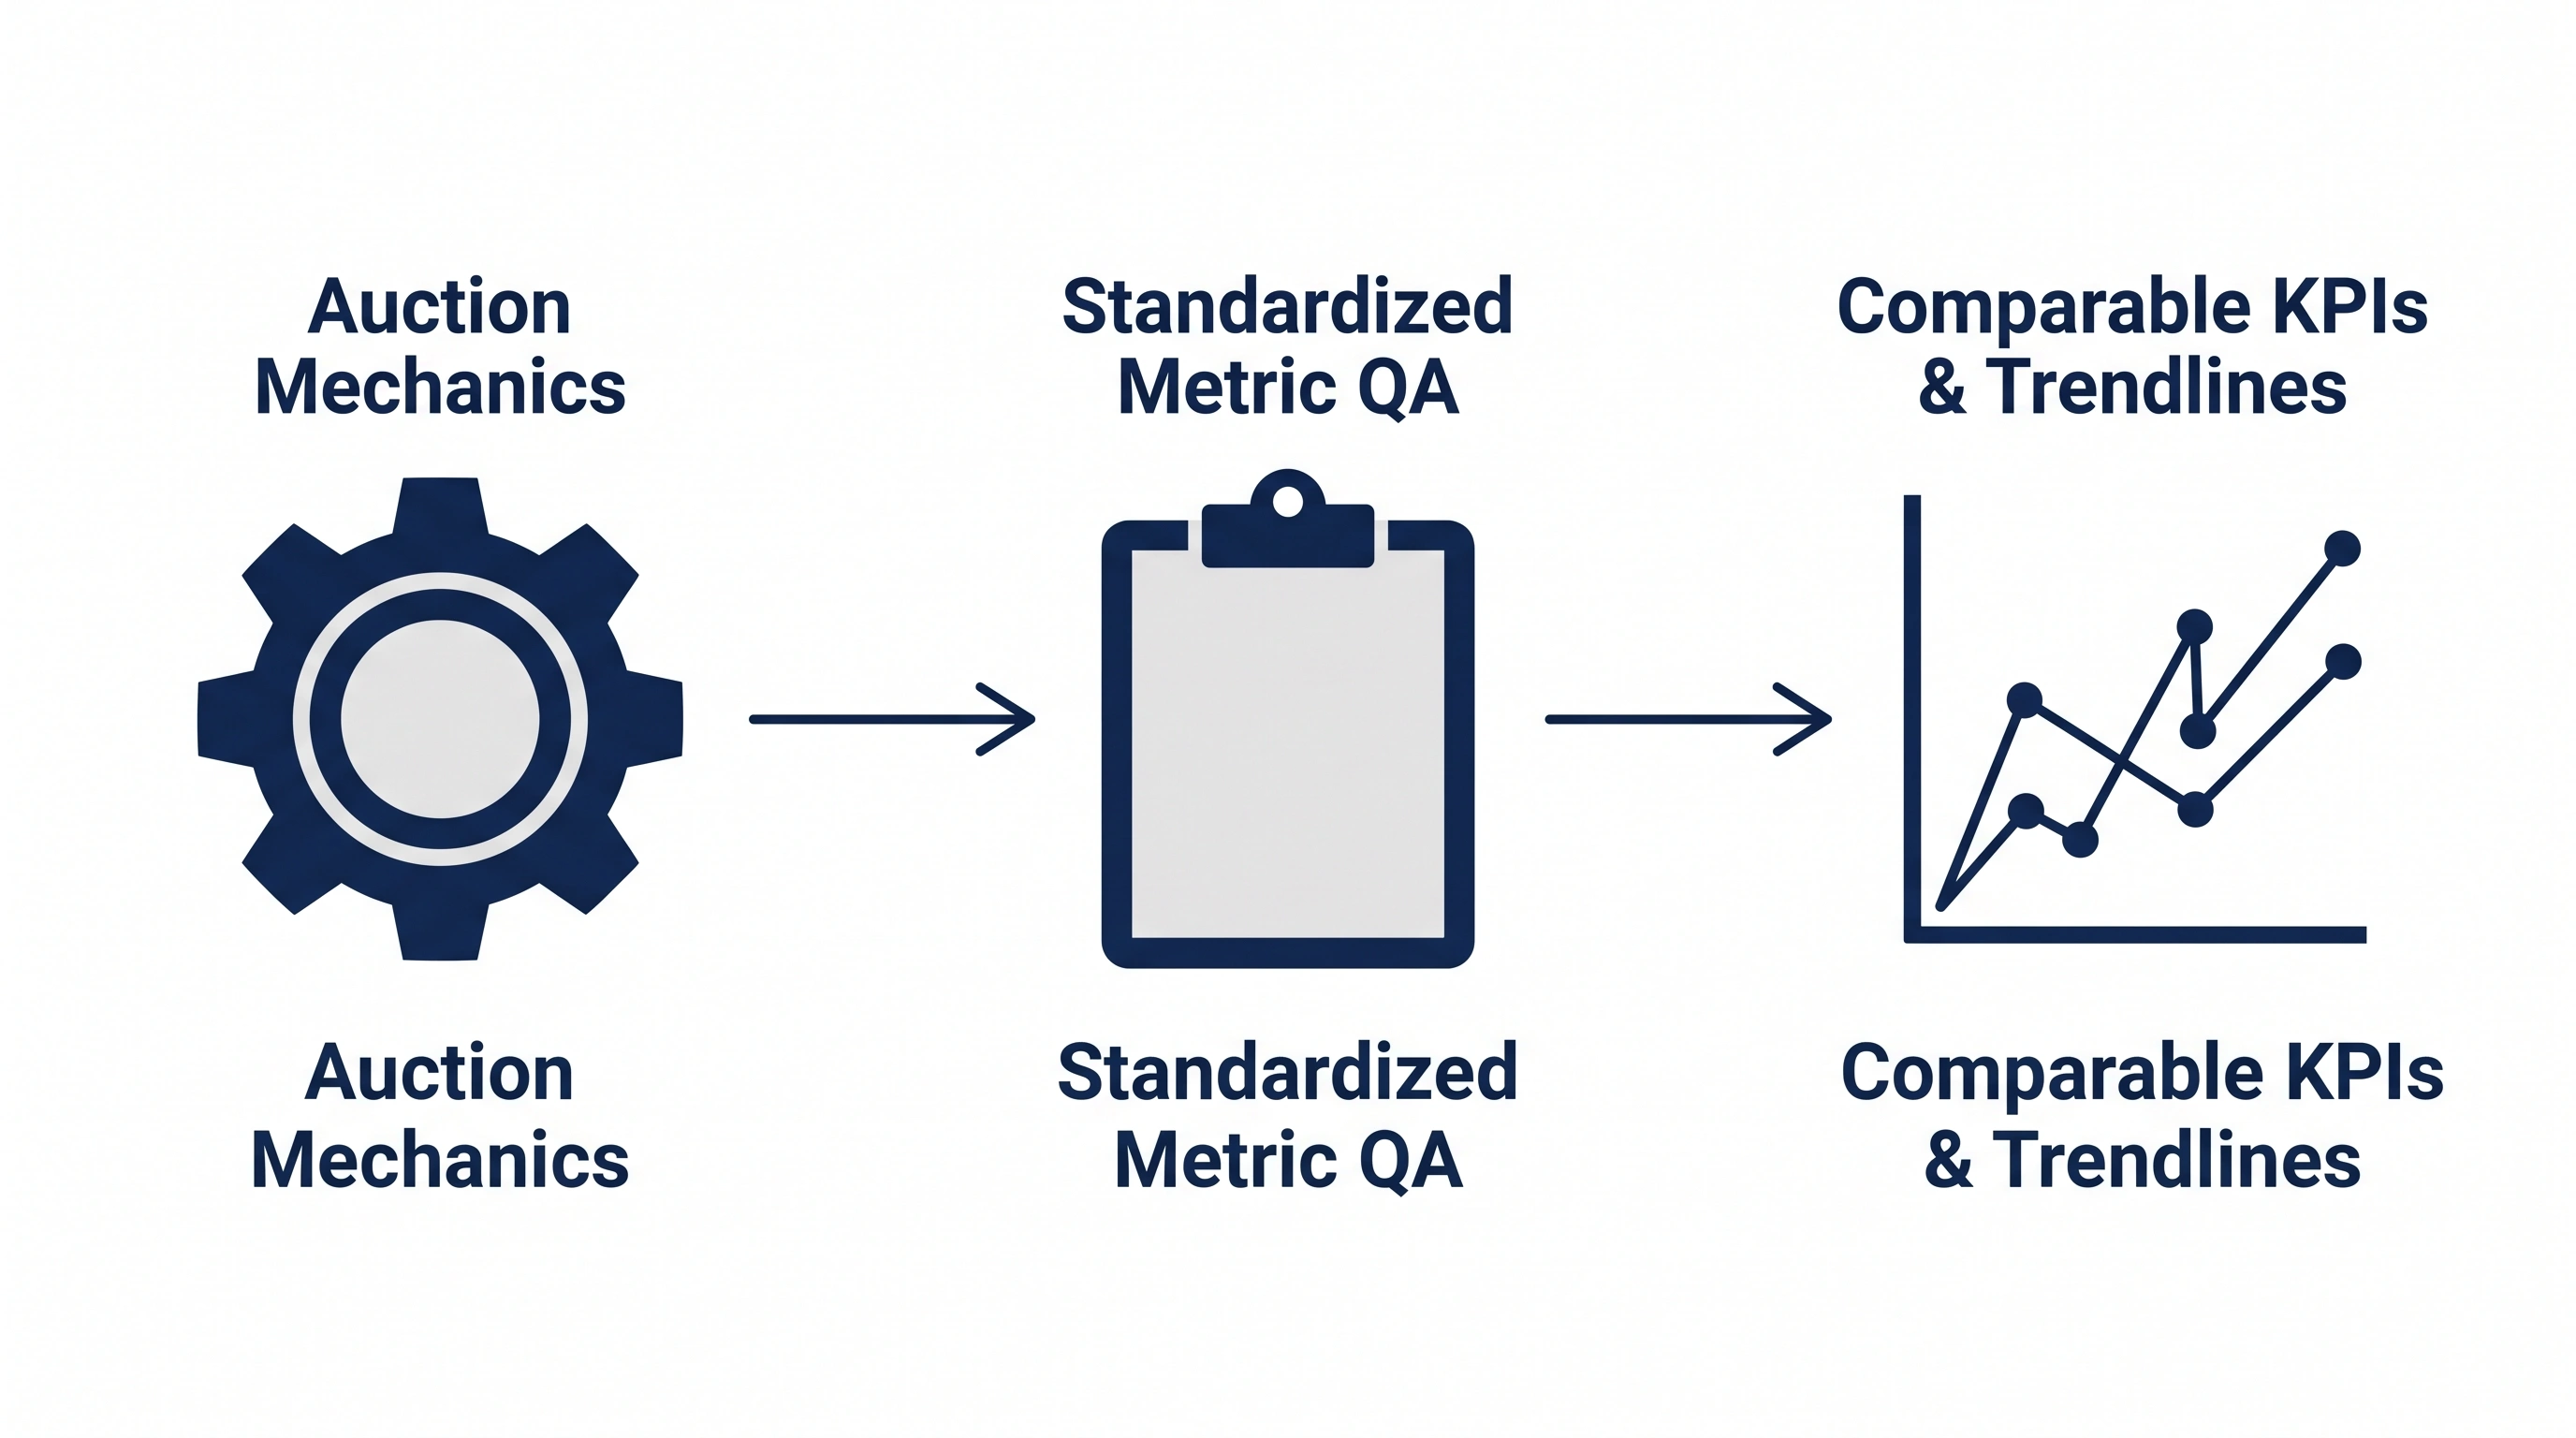
A checklist approach helps keep performance metrics comparable as auction rules evolve.
Key takeaways
- Treat remedies as operational change management: focus on measurement, QA, and comparability over time.
- Baseline auction and delivery metrics now so future shifts are interpretable, not mysterious.
- Standardize KPI definitions and naming across partners to keep trendlines valid during a transition.
- Use recurring verification and controlled tests to separate auction-structure effects from creative or budget effects.
What the Google ad tech remedies are (and aren’t)
For marketers, the most practical way to think about Google ad tech remedies is as a code-of-conduct and operating-rules framework. That framing matters because operating rules can alter how auctions behave, how access works, and how reporting should be interpreted, even if nothing “breaks up” overnight.
It is also important to plan for a multi-year transition. A multi-step timeline typically means your buying and measurement environment can change in stages, not in a single moment. From an execution standpoint, that implies recurring work for buyers, ad operations, and analytics teams: updating baselines, validating definitions, and re-checking reconciliation processes as new rules and workflows take effect.
The core measurement problem is that KPI names tend to stay stable while the underlying market dynamics can change. CPM, win rate, or fill rate can remain the same fields in a dashboard, but their real-world meaning can shift if auction mechanics, access conditions, or latency patterns change. The goal of your measurement plan is to keep trendlines interpretable by anchoring them to consistent definitions and documented marketplace context.
Why measurement and reporting integrity are the real risk window
When auction dynamics shift, outcomes can change without any deliberate change on your side. That is why the highest-risk window is not only performance fluctuation, but misattribution. If CPM rises or win rate drops during a transition, teams may incorrectly blame creative, targeting, or pacing when the driver is actually auction structure or access conditions.
Comparability issues show up in two directions: across time and across partners. Across time, a pre-change month and a post-change month may not be directly comparable if auction rules or buyer access have changed. Across partners, the same “win rate” or “fill rate” label can hide different calculation rules, filtering, or timeout handling. If you do not standardize definitions and document known differences, you can end up making optimization decisions based on mismatched yardsticks.
Symptoms worth watching for tend to look like “unexplained shifts” that do not align with changes in spend, creative rotation, or audience strategy. Build alerting and investigation muscle for patterns such as the following:
- Fill changes that do not match demand shifts you can explain (for example, stable budgets but lower delivered impressions).
- Floor sensitivity signals: performance changes that correlate with price floors or pricing thresholds in ways that were not present before.
- Latency or timeout sensitivity: sudden changes in delivery, win rate, or eCPM that line up with response-time pressure or timeouts.
- Reporting integrity warnings: growing discrepancies between systems, or dimension-level shifts (placements, geos, devices) that look “too clean” or too abrupt to be organic.
Baseline now: the minimum metrics set to capture before changes land
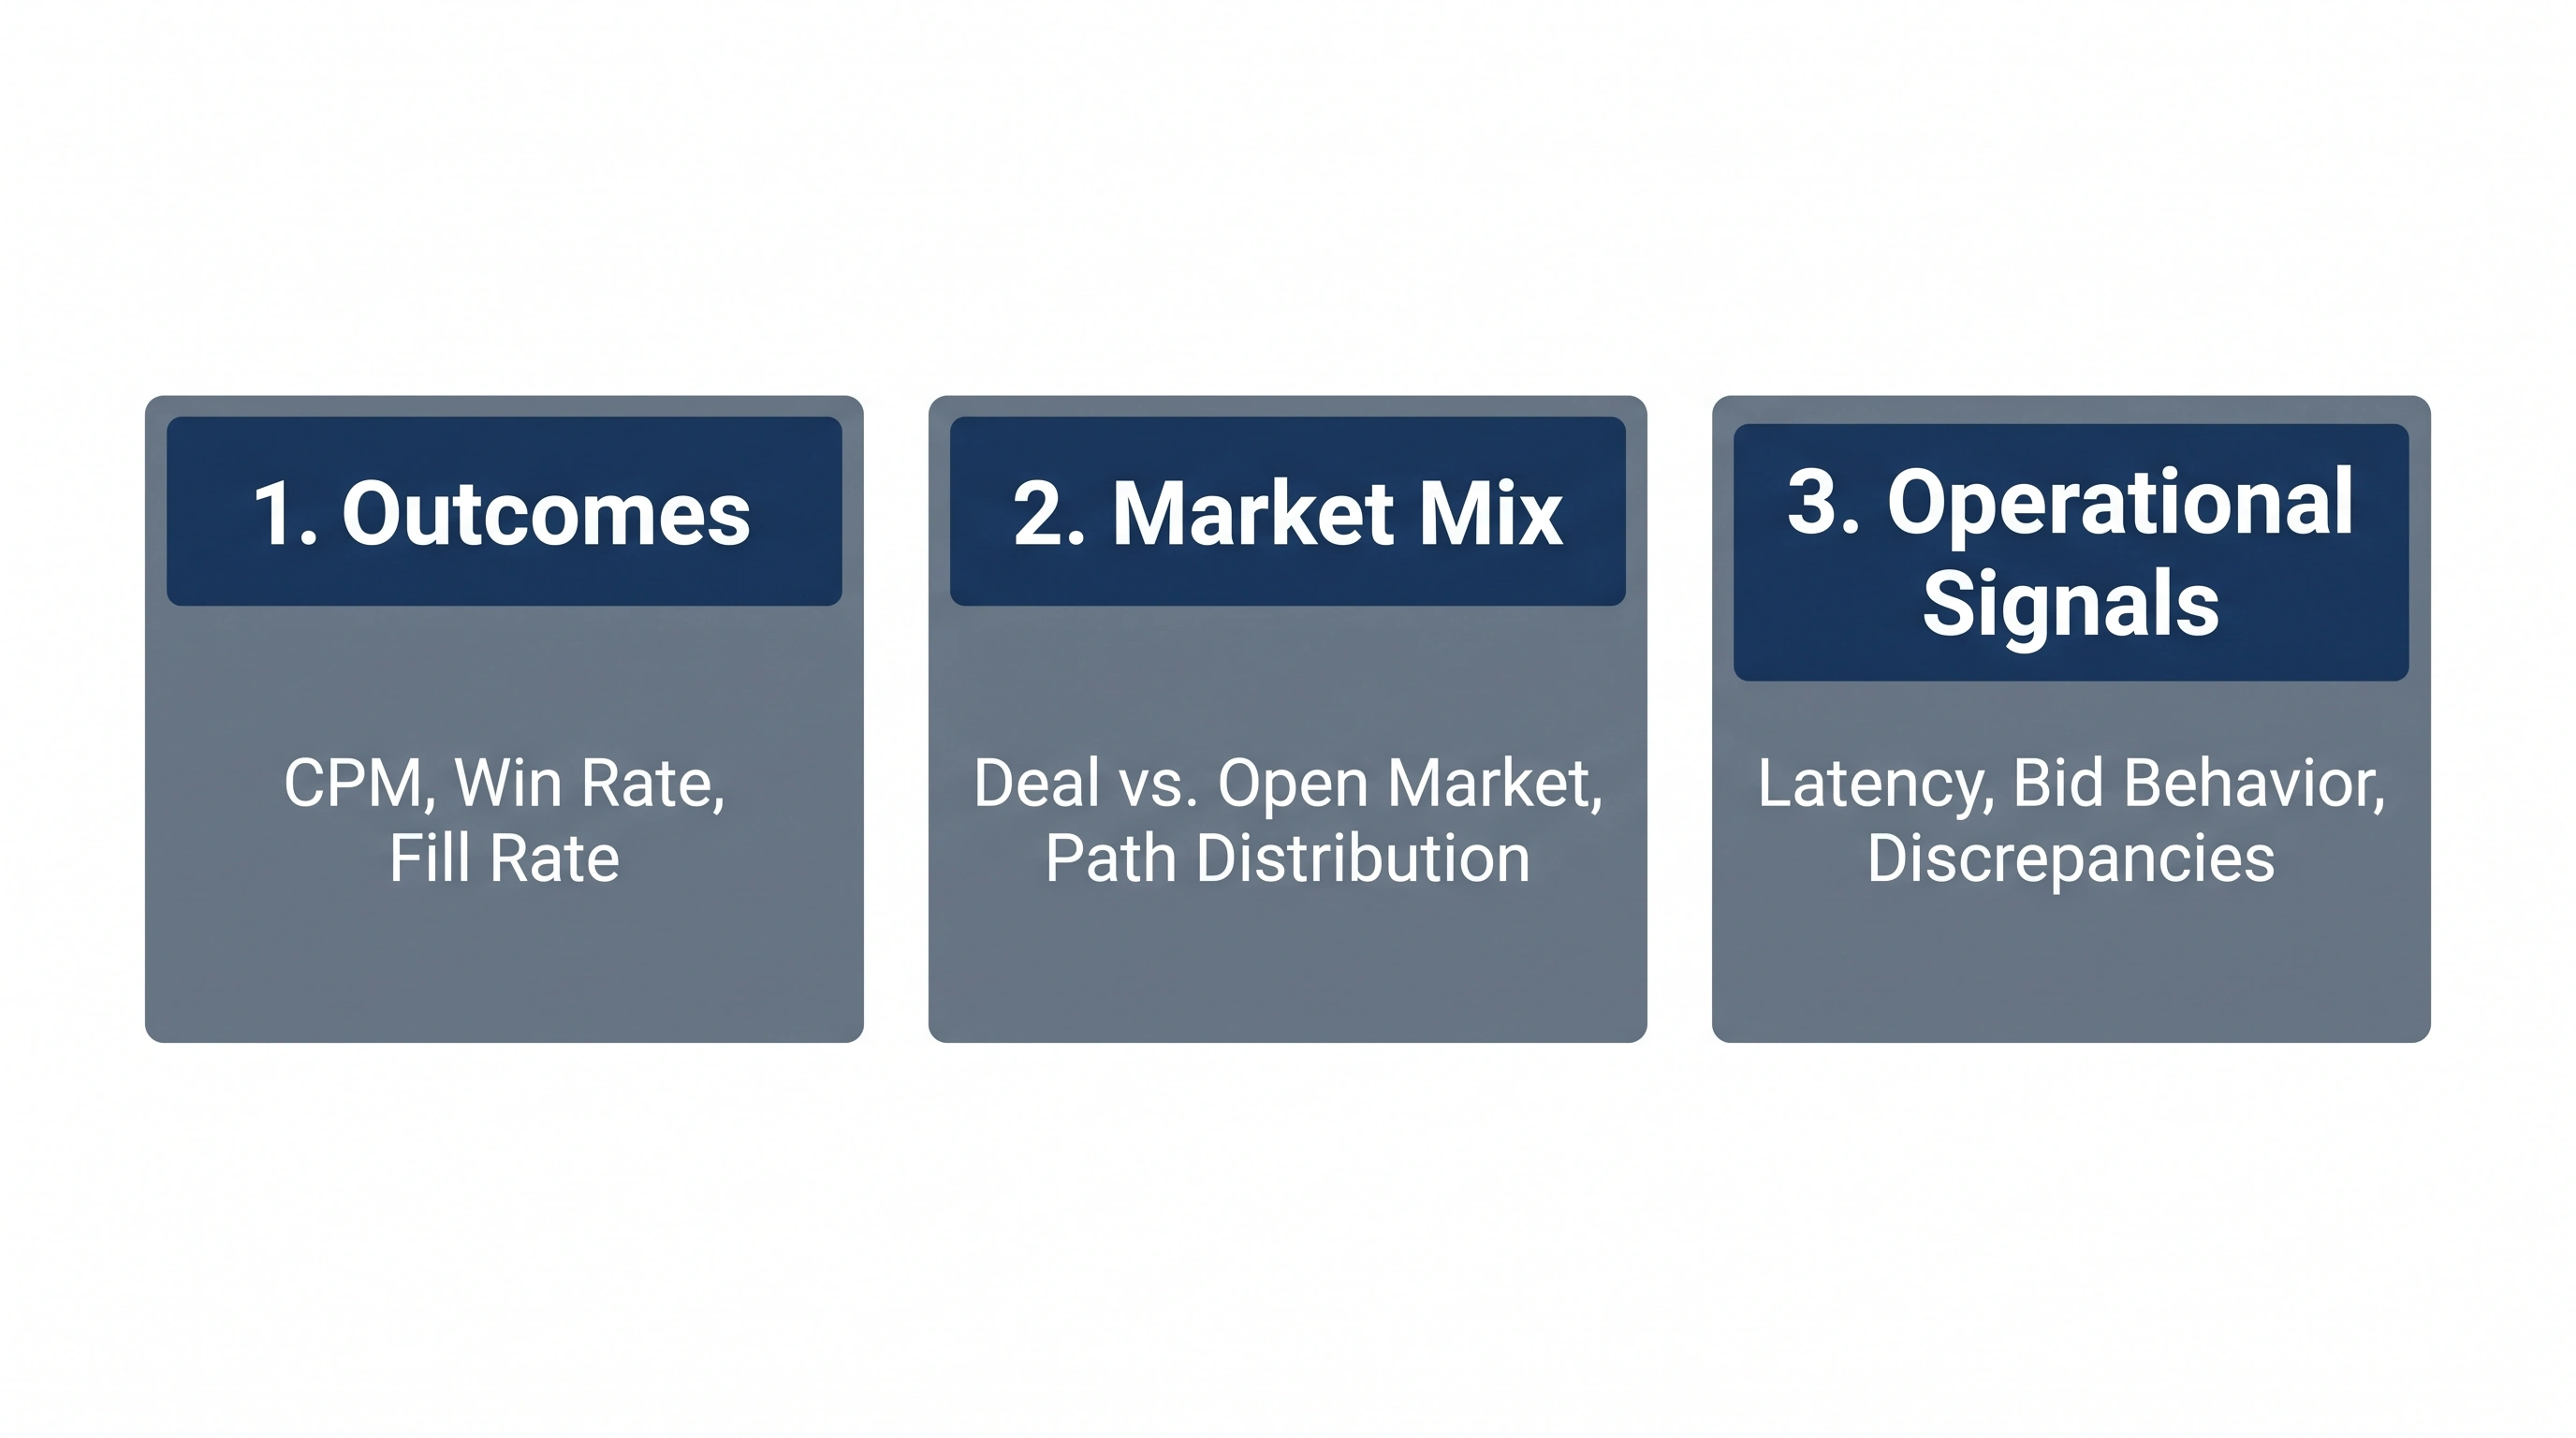
A minimal baseline groups what to capture into outcomes, mix, and operational signals.
Your best defense against measurement confusion is a clean baseline. The baseline should be light enough to maintain, but complete enough to explain future deltas. Capture it at a consistent cadence (weekly or monthly) and store it outside any single platform UI so you can compare later.
1) Baseline auction outcomes
- CPM: record overall CPM and, if possible, by meaningful cuts such as device, geography, and top placements.
- Win rate: track at the same level of aggregation you use for optimization decisions, and document how each partner defines it.
- Fill rate: capture fill and delivery consistency, and note the exact denominator used (for example, requests vs opportunities), since definitions can vary.
2) Baseline market mix
Auction outcomes are easier to interpret when you can also see how your supply and buying paths are composed. Record a market-mix snapshot so later performance movement can be tied to mix changes rather than assumed to be creative-related.
- Deal vs open-market share: track the share of spend and impressions coming from deals versus open market.
- Partner and path mix: document where spend is flowing and how that distribution changes over time.
3) Baseline auction behavior and operations
Operational signals often explain performance swings before a top-line KPI does. Even if you cannot observe every mechanism directly, you can still baseline proxy metrics and workflow indicators that help diagnose changes.
- Bid behavior (if observable): if your partners expose any bid-related diagnostics (for example, patterns consistent with bid shading behavior), capture them consistently and note any known limitations.
- Timeout and latency rates: record timeout-related signals and response-time indicators where available, since auction outcomes can be sensitive to latency.
- Discrepancy rates between systems: track the gap between buying platform reporting and your ad server or other independent logs where you have access. Store discrepancy definitions and the exact comparison windows used.
Practical implementation guidance: create a single “baseline workbook” with a locked set of fields, filters, and definitions. Add a short narrative note for each period describing any known context (measurement changes, naming updates, major trafficking changes) so future analysts do not have to guess why a line moved.
Verification checklist: QA delivery and reconcile reporting across partners
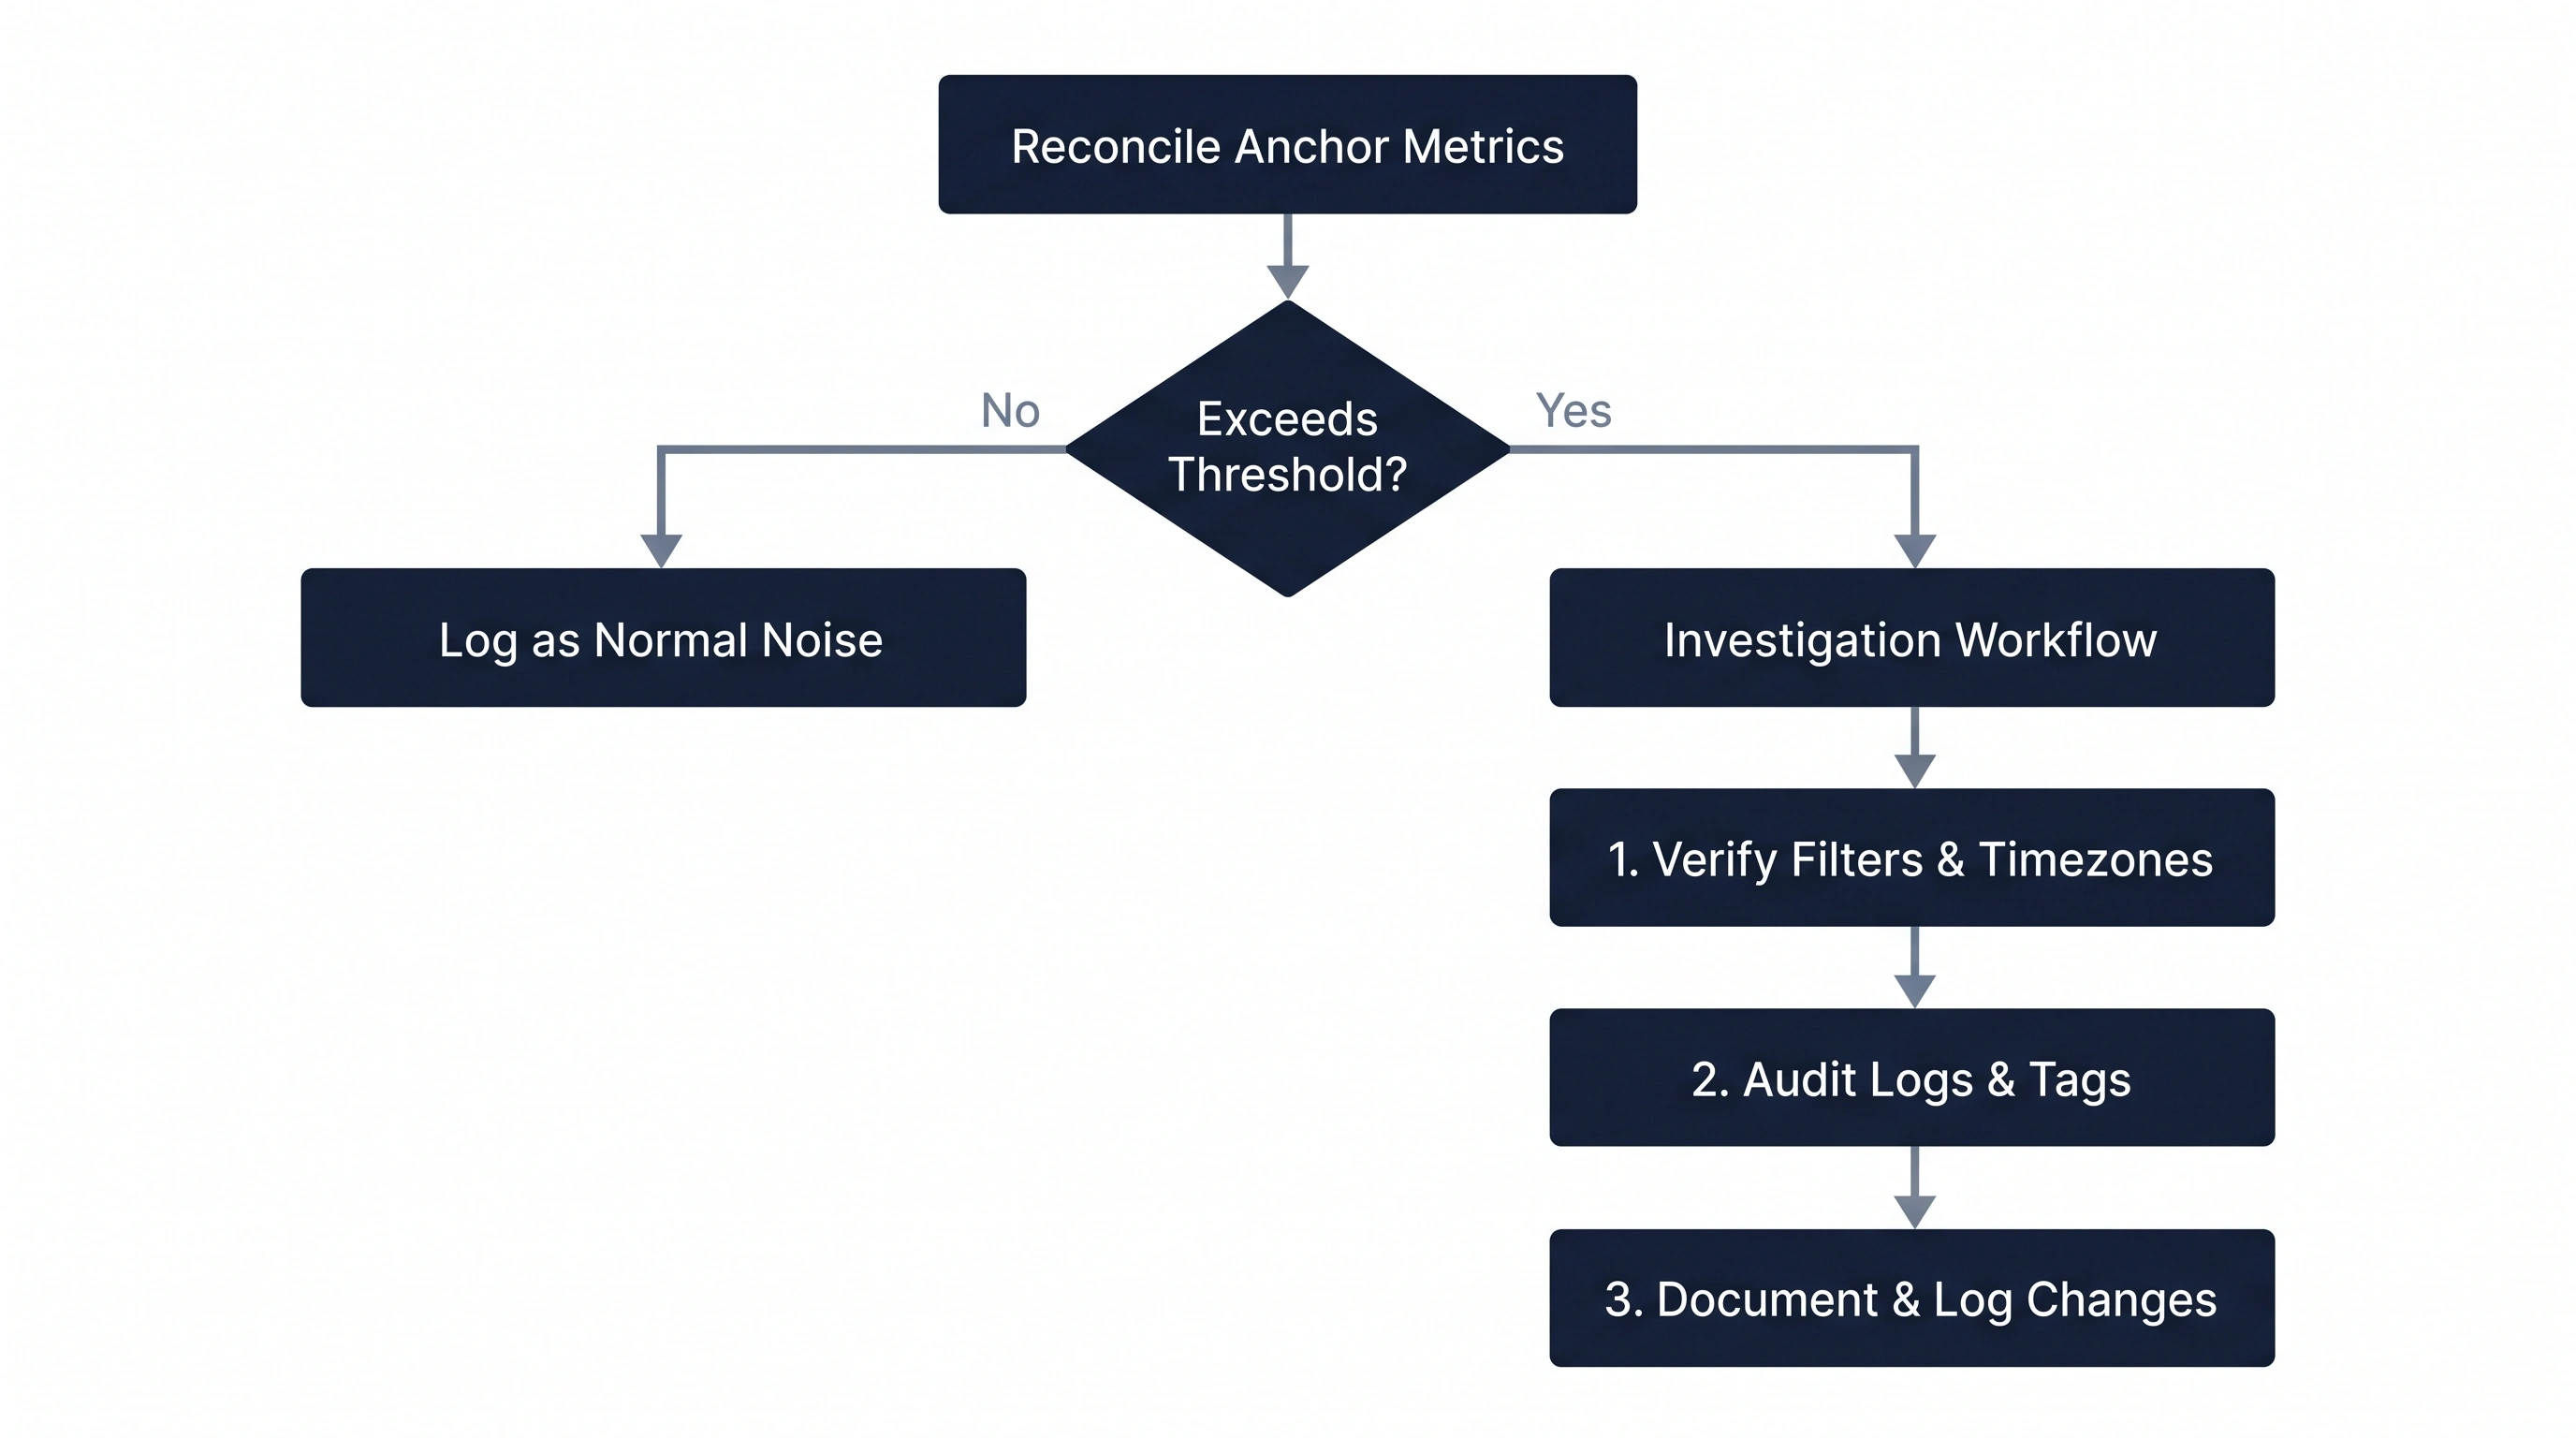
Reconcile a few anchor metrics first, then route discrepancies through a repeatable investigation workflow.
Baselines only help if the data is trustworthy. A verification checklist reduces the odds that you optimize on a reporting artifact. The goal is not to assume bad faith, but to create a routine that catches breakages, definition drift, and ingestion issues early.
1) Reconcile platform reporting with independent data where available
- Choose your reconciliation anchors: pick a small number of metrics you can compare across systems consistently (for example, impressions, spend, and basic delivery counts).
- Use stable comparison windows: reconcile on the same time zone, attribution window, and reporting cutoff each time to avoid false discrepancies.
- Check dimension integrity: where possible, compare top dimensions (such as placement or device) to spot sudden distribution changes that may signal mapping or classification changes.
2) Create a discrepancy and anomaly workflow
Verification fails when it is ad hoc. Make it a simple, repeatable workflow with clear thresholds and documentation.
- Thresholds: define what counts as “normal noise” versus “investigate now” for discrepancies and sudden KPI shifts.
- Investigation steps: write a short sequence that begins with obvious checks (time zones, filters, campaign flight changes) and escalates to deeper checks (log sampling, tag audits, partner support tickets) only as needed.
- Documentation: record what changed, who investigated, what was concluded, and what was updated (definitions, dashboards, trafficking).
3) Standardize KPI and dimension definitions
During a transition, the most common failure mode is definition drift. Standardize naming and definitions so quarterly comparisons remain valid even as operational rules evolve.
- Data dictionary: maintain a simple dictionary that defines each KPI, its source system, and known caveats.
- Consistent naming: keep campaign, placement, and deal naming conventions stable so you can trend and segment without rework.
- Change log: keep a running log of taxonomy changes, dashboard updates, and measurement revisions so performance shifts can be interpreted with context.
Practical testing plan during the transition: protect learnings as auctions change
If auction mechanics and access rules evolve, your historical learnings may degrade. A lightweight testing plan helps ensure you do not overfit to a “before” environment that no longer exists.
1) Set a quarterly review cadence
- Partners: review partner mix and any notable changes in delivery patterns or reporting fields.
- Measurement definitions: confirm your KPI definitions have not drifted and that dashboards still reflect the intended logic.
- Dashboards: audit key charts for silent breakages like changed filters, renamed dimensions, or inconsistent date handling.
2) Use controlled experiments and holdouts
When the market structure changes, you need ways to separate “environment effects” from “strategy effects.” Controlled tests help you avoid attributing a market-driven swing to your optimization decisions.
- Holdouts: keep a small, stable portion of spend, inventory, or targeting constant as a reference point.
- Controlled changes: change one major lever at a time (creative, audience, or buying path) so results are interpretable.
- Measurement checks: validate that primary metrics move in coherent ways across systems, and investigate if only one system reflects a shift.
3) Re-validate creative and audience learnings
As auctions change, reach, frequency, and placement mix can shift, which can change apparent creative performance. Protect your decision-making by periodically re-testing what you think is “winning.”
- Refresh creative comparisons: rerun key creative matchups under current conditions rather than assuming historical winners remain winners.
- Watch mix-driven effects: if placement or device mix changes, interpret creative results with that context before making big production or budget moves.
- Update assumptions: document when a prior learning is no longer reliable because the delivery environment has changed.
Sources
Frequently asked questions
What changes with Google ad tech remedies for programmatic buyers?
From a marketer’s perspective, the practical focus is on evolving operating rules that can affect auction behavior, access conditions, and how performance metrics should be interpreted over time. Because change can unfold across a multi-year transition, buyers should plan for ongoing measurement updates, not a one-time adjustment.
Why can auction changes affect CPM, win rate, or fill rate even if my creative stays the same?
Because CPM, win rate, and fill rate are outputs of auction mechanics and marketplace conditions. If auction rules, access, latency sensitivity, or buying-path mix changes, those KPIs can move even when your creative, targeting, and budgets do not. That is why pre-change baselines and consistent definitions are essential for correct attribution.
What should I baseline now to monitor Google ad tech remedies over time?
At minimum, baseline auction outcomes (CPM, win rate, fill rate), market mix (deal vs open-market share and partner or path mix), and operational signals (timeout or latency indicators where available, plus discrepancy rates between systems). Store definitions and filters alongside the numbers so you can recreate the same view later.
How do I set up a media buying verification checklist to protect reporting integrity?
Establish a recurring routine that reconciles platform-reported results with independent logs or other systems where available, using consistent time windows and definitions. Define discrepancy thresholds and an investigation workflow (quick checks first, deeper diagnostics second), and document outcomes. Maintain a shared data dictionary and stable naming conventions so partner and quarter-over-quarter comparisons remain valid.
.webp)
.webp)

.webp)
.webp)
.webp)