Meta’s Engage-Through Attribution: How to Read Results When Clicks Aren’t the Only Lens
.webp)
Meta engage-through attribution is a reporting approach that attributes outcomes to on-platform engagement behaviors, not only to ad clicks. Because the attribution lens changes, performance reports can shift even if underlying user behavior stays the same. To read results responsibly, teams should baseline and archive pre-change reporting, document KPI definitions, and treat pre vs post as a measurement-definition change first. Then update creative testing so each hypothesis targets a specific engagement behavior and validate engagement lifts against downstream KPIs before changing budgets.
.gif)
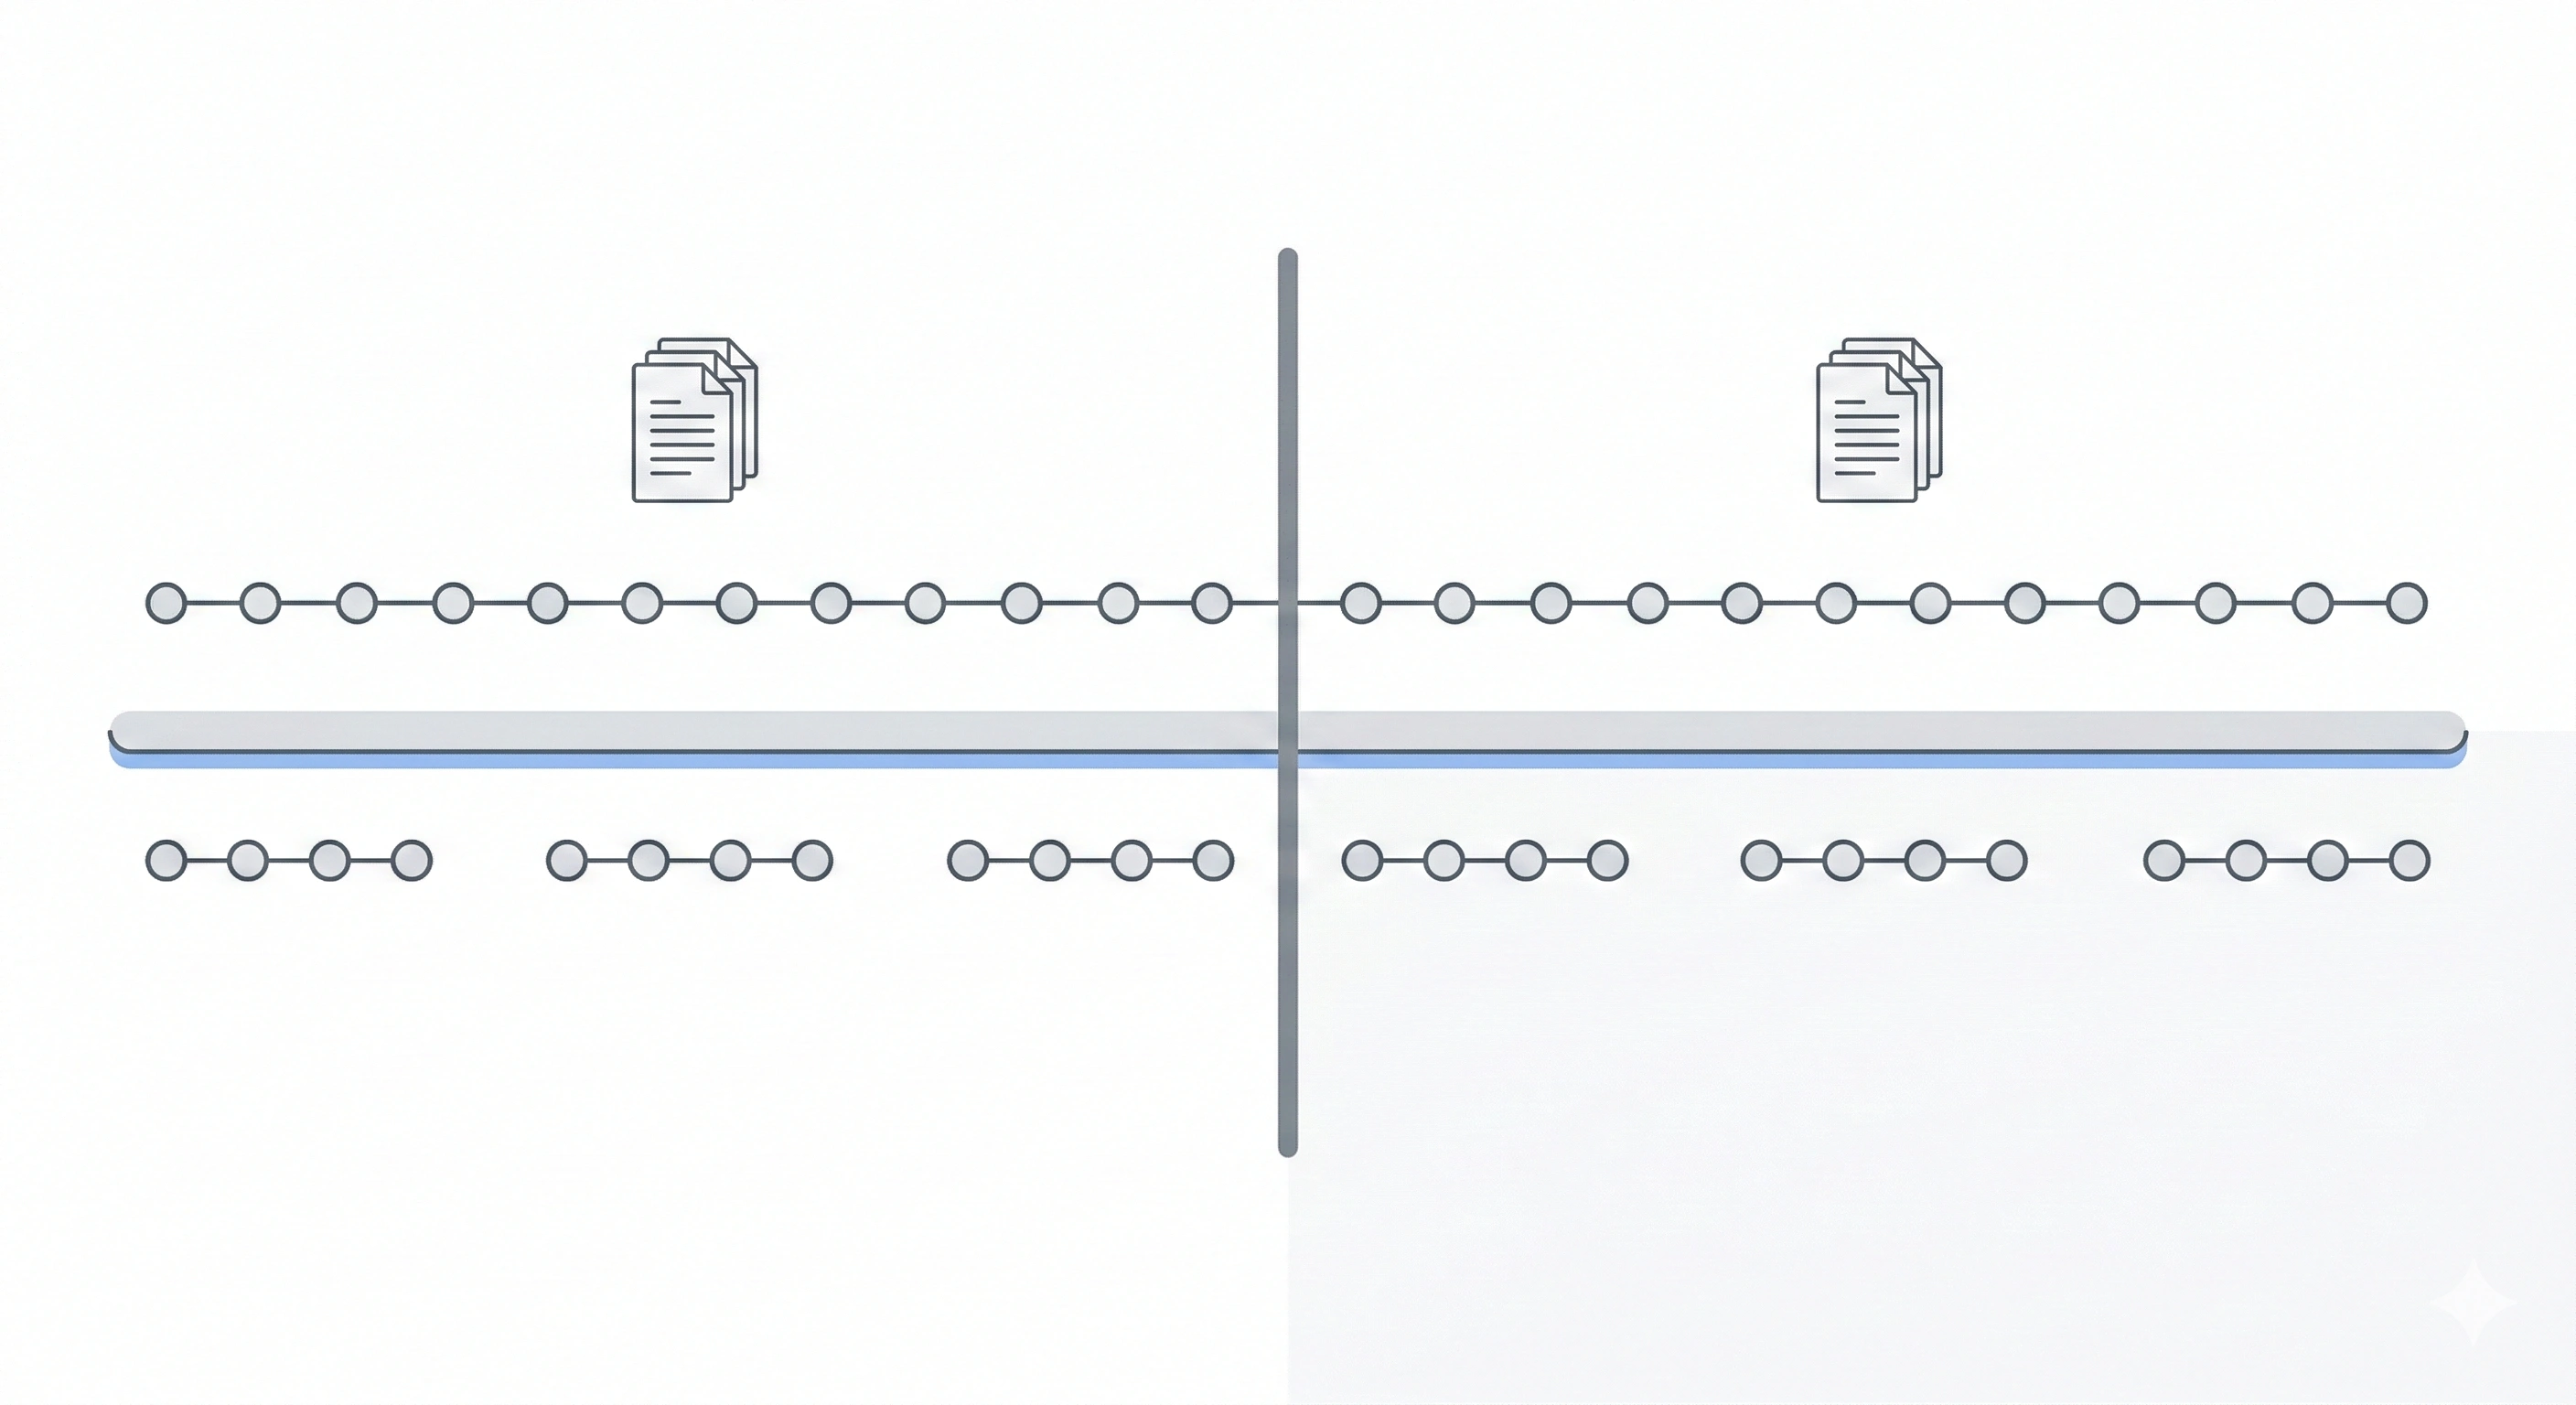
A shift from click-only credit to engagement-inclusive credit can change reported results without changing behavior.
Key takeaways
- Treat engage-through attribution as a measurement-definition change first, not an immediate performance win or loss.
- Baseline now: export and archive pre-change reports and document KPI definitions used in executive reporting.
- Build an engagement taxonomy so “engagement” is not a single ambiguous KPI, and map signals to funnel intent.
- Redesign creative tests so each hypothesis predicts a specific engagement behavior, then validate against downstream KPIs before shifting budgets.
What changed: from click-through attribution to engage-through attribution
Click-through attribution is the familiar lens where reporting ties outcomes primarily to users who clicked an ad. In that model, clicks become the main “credit assignment” mechanism for how performance is explained and compared over time.
Engage-through attribution expands the lens by segmenting social engagement behaviors as attributable actions, not only clicks. Practically, this means reporting can give visibility to outcomes that follow from engagement on the platform, even when a click is not the main path being emphasized in the report.
Because the attribution lens changes, teams may see shifts in reported performance that are caused by reporting methodology rather than by true changes in audience demand, creative quality, or media efficiency. The first job is to separate “definition change” from “performance change” before drawing conclusions.
Why it matters: trendlines, optimization decisions, and stakeholder reporting can break
Month-over-month and year-over-year comparisons assume that the same definitions were used to calculate metrics. When attribution rules or reporting segmentation changes, those comparisons can become misleading because you are no longer comparing like with like.
Common failure modes show up quickly when a new engagement-based attribution view becomes more prominent:
- Misreading an apparent improvement: If a report now credits more results to engagement, it can look like performance “jumped” even if delivery and user behavior are stable.
- Over-optimizing to the newest visible metric: When a new attribution lens highlights engagement, teams may chase that number without a clear link to business outcomes.
- Confusing engagement with conversion impact: Engagement can be a useful signal, but it is not automatically equivalent to incremental conversions or revenue.
The practical expectation to set with stakeholders is simple: reporting narratives must explicitly separate measurement shifts (how the platform is counting and segmenting credit) from true behavioral change (what the audience is actually doing differently). If you skip that step, strategy decisions can follow a false story.
Baseline before the change: a minimum documentation checklist
Archive pre-change reporting and label which metrics remain comparable across the attribution change.
Before any reporting change creates a discontinuity, create an anchor dataset. The goal is not to “freeze” the old world, but to preserve a reference so you can explain breaks in trendlines and keep planning grounded.
Minimum checklist:
- Export and archive pre-change reports: Pull the core reports your team uses for weekly, monthly, and quarterly reviews. Keep the raw exports and the summarized versions used in decks so you can reconcile any differences later.
- Document current definitions: Write down what each KPI means in your current reporting, including which actions are counted and what attribution lens is assumed in your standard readouts.
- Lock the executive KPI set: List the KPIs you routinely present to leadership so the organization can identify which trendlines may be disrupted and which can still be compared.
Create a simple pre vs post comparison plan that answers three questions:
- What will be held constant? For example, the same campaign groupings, the same breakdowns, and the same reporting cadence so you do not add extra variables.
- What will be treated as non-comparable? If a metric’s definition is directly affected by the new attribution lens, label it as not comparable across the boundary without adjustment.
- How will you explain the break? Add a short “methodology note” that can be pasted into stakeholder updates whenever someone asks why a number shifted.
This documentation step is also a quality check: it forces alignment on what you have actually been optimizing for, and whether your KPI names match what the metrics truly represent.
Build an engagement taxonomy that maps engagement types to funnel intent
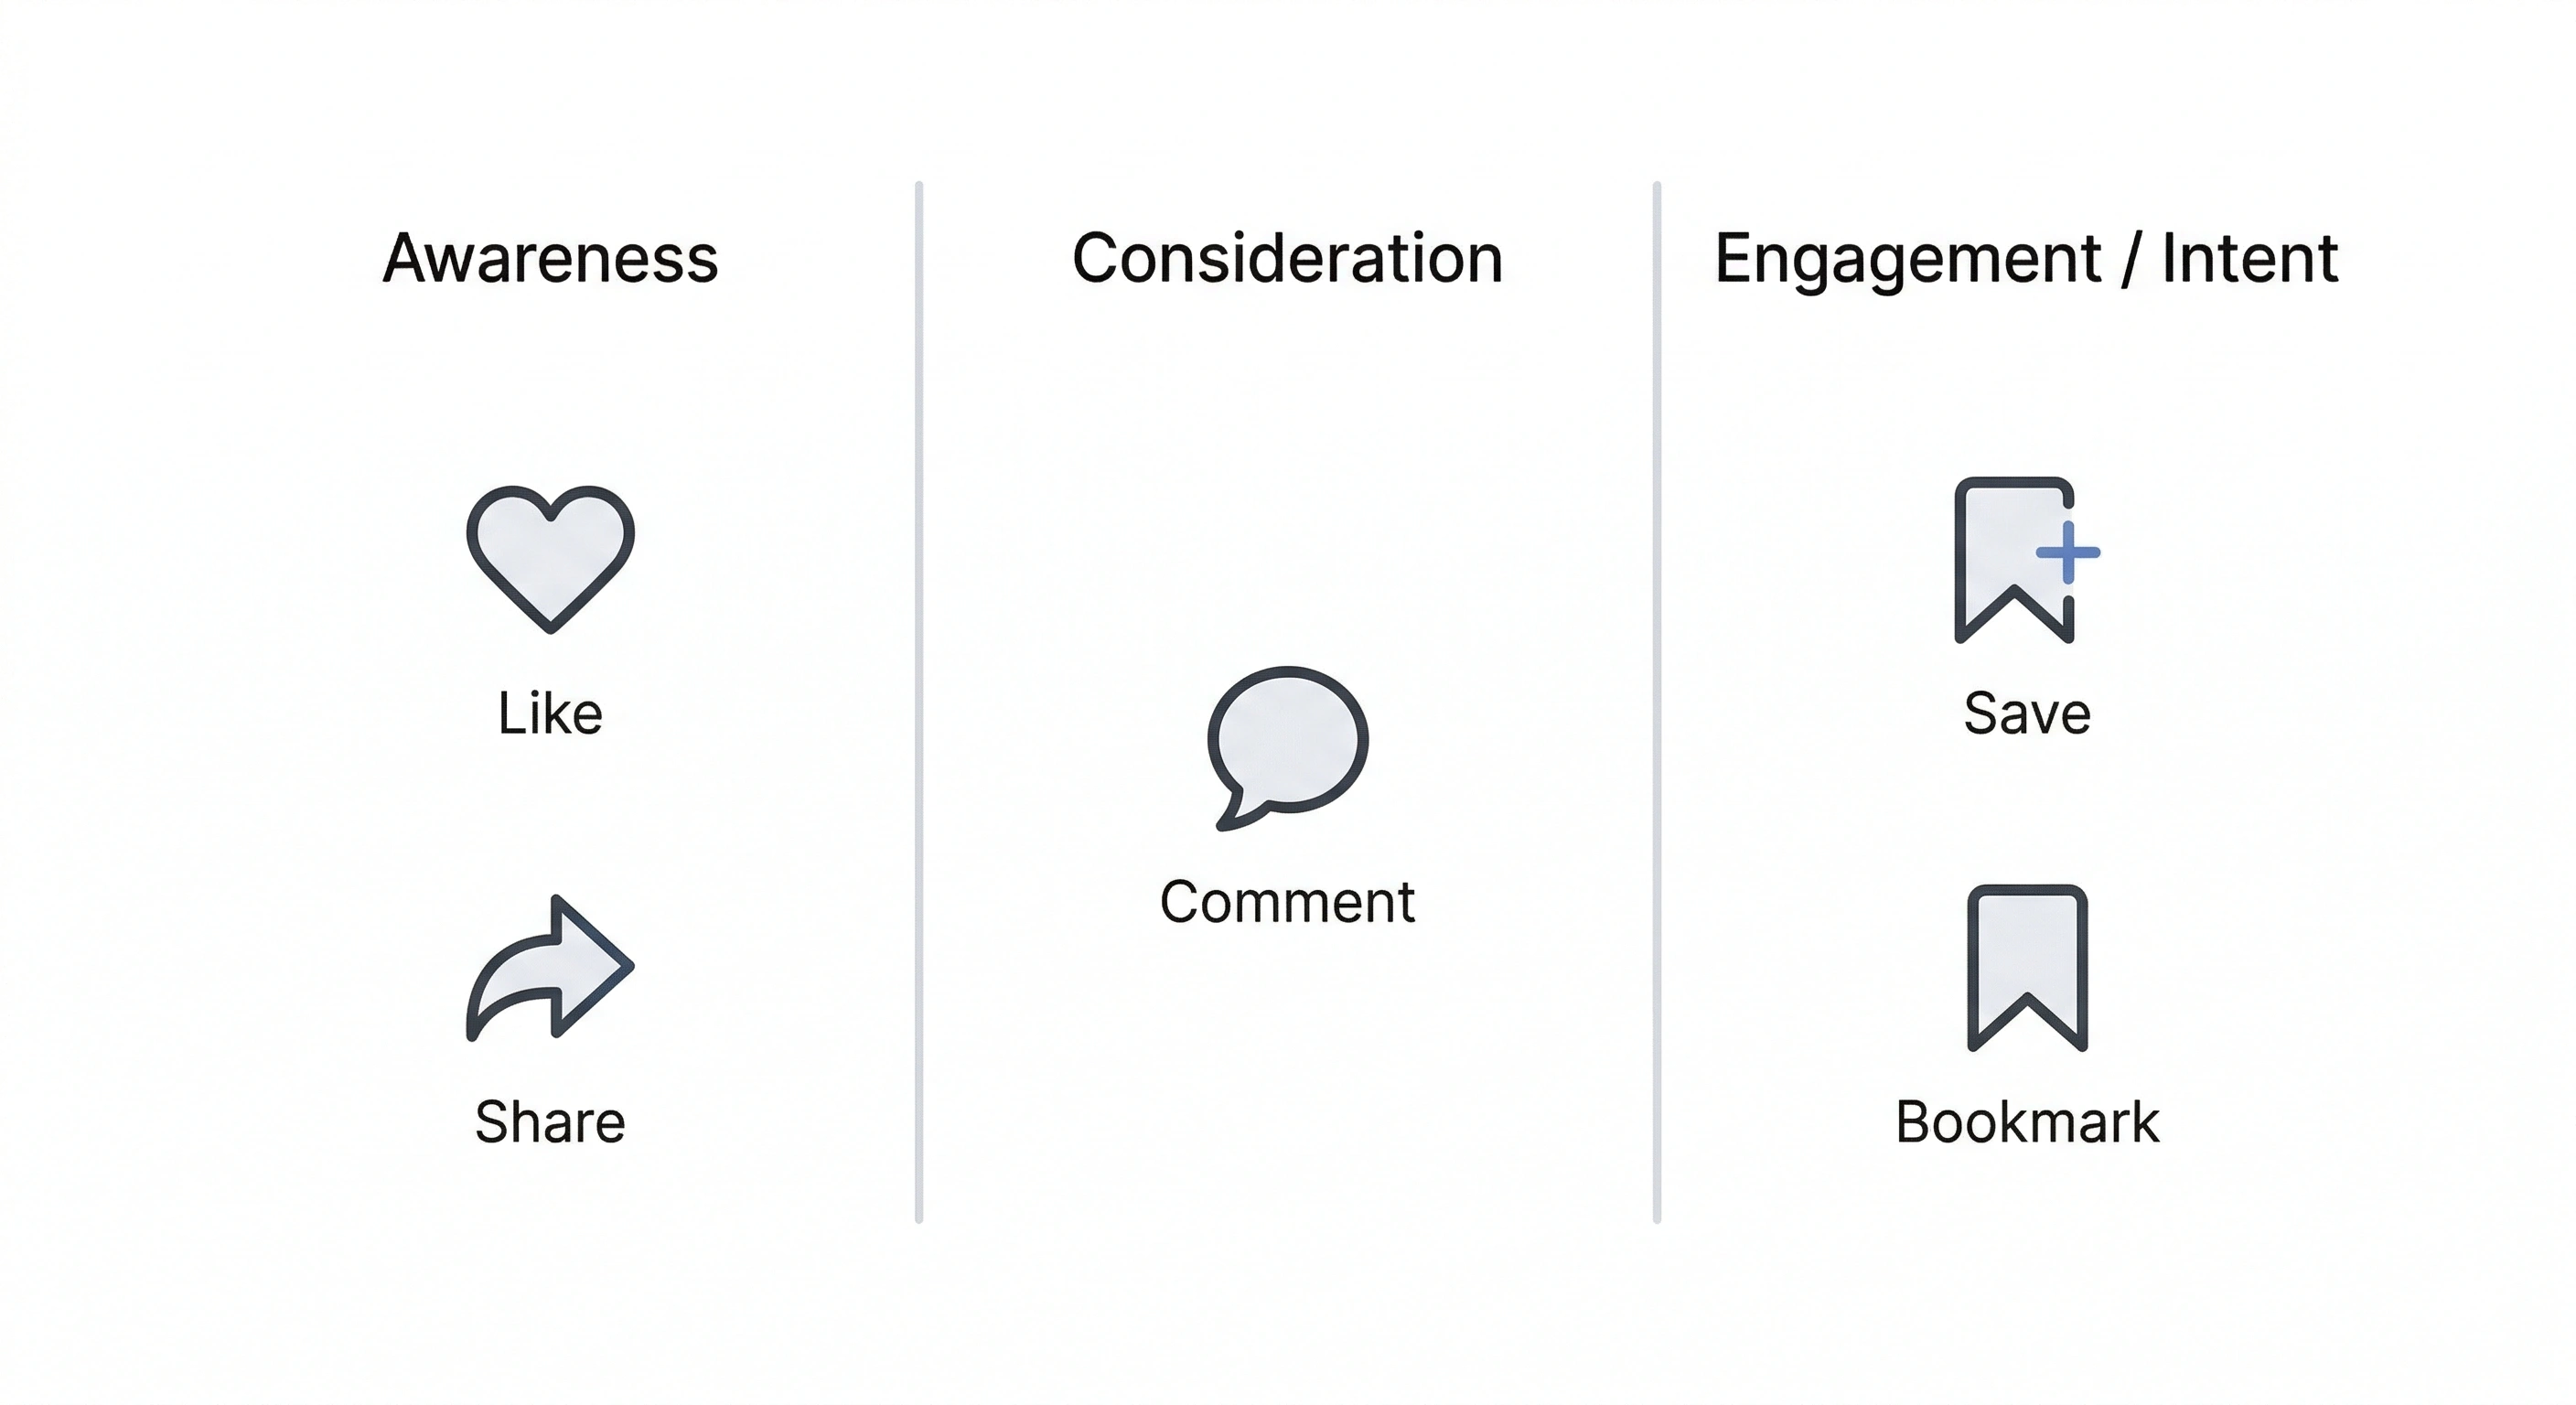
Define engagement by type and map each action to the funnel intent your team will use in reporting and testing.
Once engagement becomes more visible in attribution reporting, “engagement” needs to be broken into meaningful categories. A taxonomy prevents teams from treating every interaction as equal and helps creative and media teams optimize toward the right signals.
Start by classifying the engagement types you plan to track and discuss consistently, such as:
- Saves
- Shares
- Comments
- Bookmarks
- Likes (as applicable to your reporting view)
Next, map each engagement type to a hypothesized user intent by category and funnel stage. The point is not to claim a universal truth about what each action means, but to define how your team will interpret it as a leading indicator. For example:
- Saves or bookmarks: Often treated as “I want this later,” which can align to consideration for how-to content, checklists, or reference material.
- Shares: Often treated as “this represents me or will help someone else,” which can align to identity, culture, or utility framing.
- Comments: Often treated as “I want to respond,” which can align to debate, questions, or community-oriented prompts.
- Likes: Often treated as lightweight approval, which may be useful for gauging resonance but typically needs additional context.
Finally, decide which engagement signals are primary versus secondary for optimization and reporting. A practical approach is to define one primary engagement signal per campaign objective or creative theme, then keep the others as diagnostics. This reduces the risk of optimizing to a blended engagement number that hides what is actually changing.
As a governance step, write the taxonomy into a one-page internal doc and make it the standard for reporting annotations, creative briefs, and post-test readouts.
Update creative testing: design hypotheses around engagement behaviors, then validate downstream
If engage-through attribution makes engagement outcomes more visible, creative testing should evolve from “drive higher CTR” to “drive a specific engagement behavior that matches the creative’s job.” That requires writing clearer hypotheses and setting guardrails so teams do not confuse engagement lift with business impact.
Write hypotheses that predict a specific engagement outcome. Examples of hypothesis structure:
- How-to or educational creative: “If the first seconds communicate a clear step-by-step promise, then saves or bookmarks will increase because the content is useful as a reference.”
- Identity or culture creative: “If the hook signals a relatable point of view, then shares will increase because people want to express affiliation.”
- Debate or prompt-led creative: “If the creative asks a clear question, then comments will increase because the content invites response.”
Structure tests to isolate the creative elements most likely to influence the target engagement signal. Keep the test design simple and controlled, such as:
- Message: Same format, different claim or framing.
- Format: Same message, different presentation.
- Hook: Same body, different opening line or first visual.
- CTA: Same creative, different instruction aligned to the intended engagement action.
Add guardrails so engagement does not become a proxy for ROI. Before you scale a winning engagement creative or reallocate budget, validate the lift against downstream KPIs you already trust, such as site actions or lead quality, and use measurement checks to confirm that what looks better in the platform is meaningfully connected to what you care about outside of it.
Where possible for your organization, layer in incrementality thinking: treat engagement lift as a hypothesis that should be corroborated with downstream evidence rather than as a standalone proof. This keeps decision-making honest when a reporting definition changes and new metrics become easier to optimize for.
Sources
Frequently asked questions
What is Meta engage-through attribution?
Meta engage-through attribution is an attribution reporting lens that segments outcomes attributed to on-platform engagement behaviors, not only to ad clicks. It makes engagement a more explicit part of how results are credited and interpreted in reporting.
How is click-through attribution different from engage-through attribution?
Click-through attribution emphasizes outcomes tied to users who clicked an ad. Engage-through attribution expands the reporting lens to include outcomes associated with engagement actions on the platform, which can change how results appear even when clicks do not.
Will Meta’s engage-through attribution change my Facebook and Instagram performance reports?
It can. When attribution reporting changes, you may see shifts in reported performance because the platform is segmenting credit differently. That can disrupt MoM and YoY comparisons unless you baseline and document pre-change definitions.
How should I update creative testing and KPI reporting after Meta’s attribution reporting change?
Baseline and archive pre-change reports, then document KPI definitions so stakeholders understand any trend breaks. Build an engagement taxonomy (for saves, shares, comments, bookmarks, likes as applicable) and map each to funnel intent. Update creative tests so each hypothesis predicts a specific engagement behavior, and add guardrails by validating engagement lifts against downstream KPIs before changing budgets or declaring ROI impact.
.webp)

.webp)
.webp)
.webp)
.webp)